Methodology - Exposing Fields of Filth: Factory Farms Disproportionately Threaten Black, Latino and Native American North Carolinians
Special thanks to Sarah Porter, Ethan Bahe, Christian Breen, Will Hendrick and the following organizations:
- Cape Fear River Watch
- Winyah Rivers Alliance
- Coastal Carolina Riverwatch
- Sound Rivers
- Haw River Assembly
- Yadkin Riverkeeper
- Catawba Riverkeeper Foundation
- MountainTrue
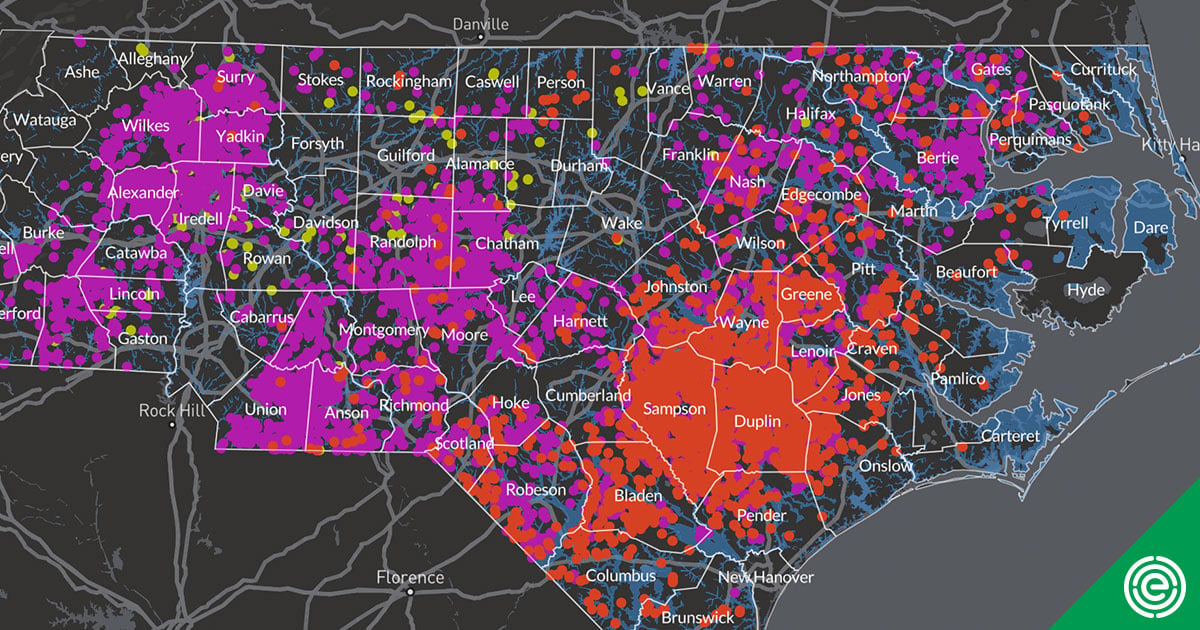
Data on the interactive map represent estimates of locations and statistics used in an attempt to accurately document poultry feeding operations, permitted swine and cattle operations and their impact on the landscape. The Environmental Working Group and Waterkeeper Alliance assume no responsibility for locational accuracy, errors or omissions represented on the maps.
Poultry Locations
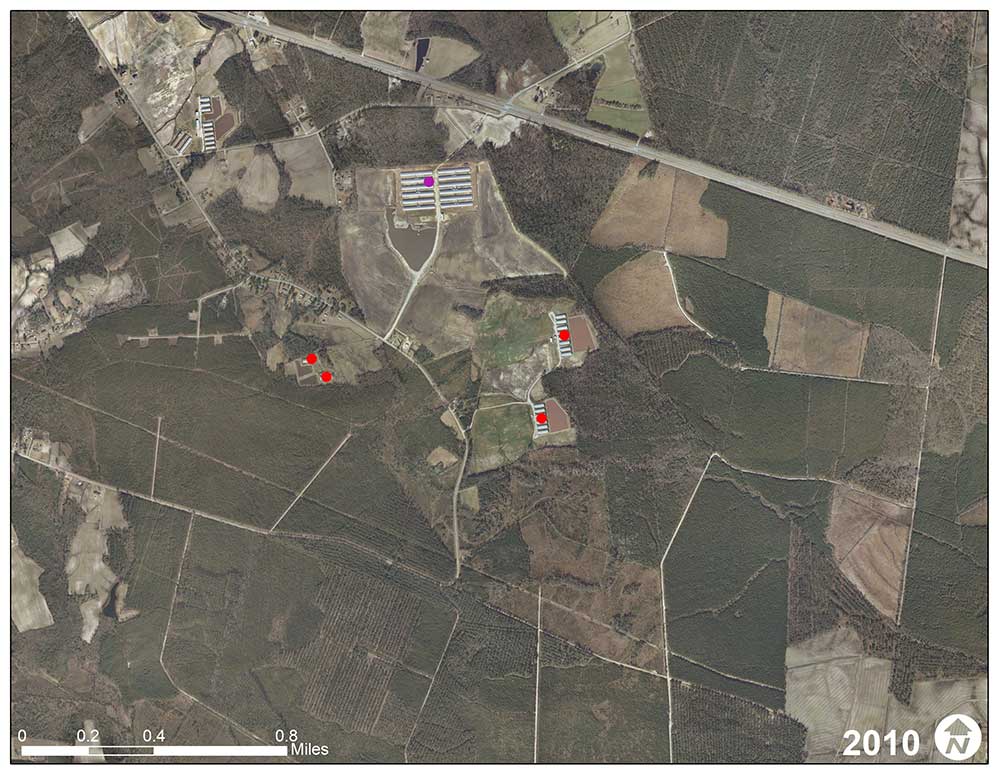
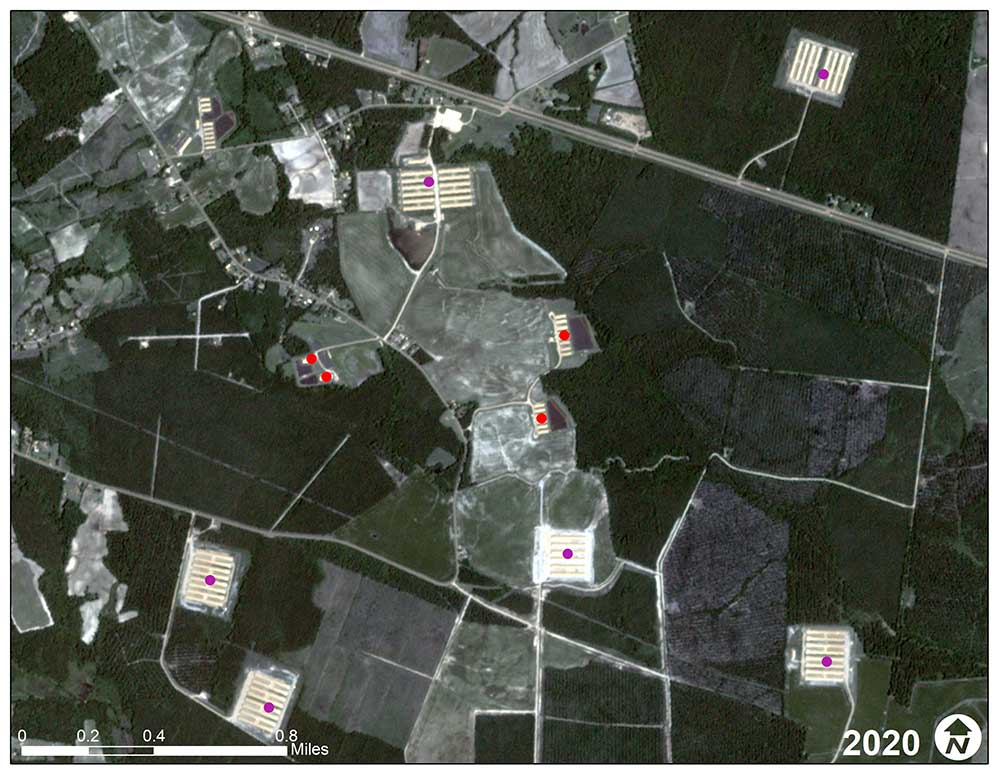
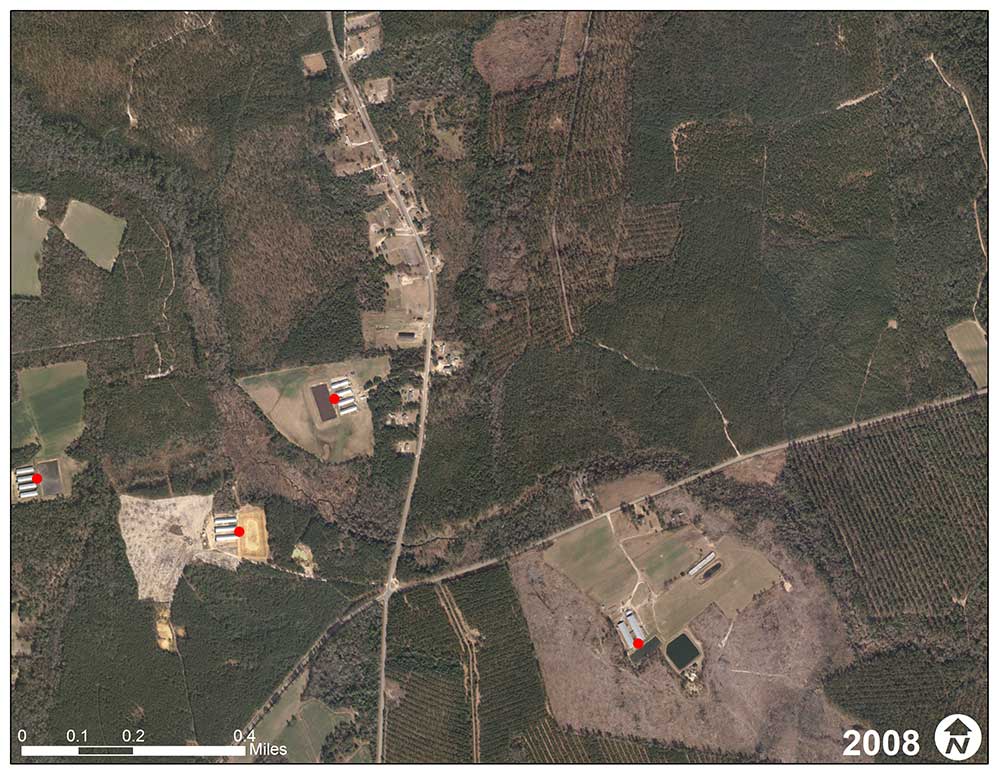
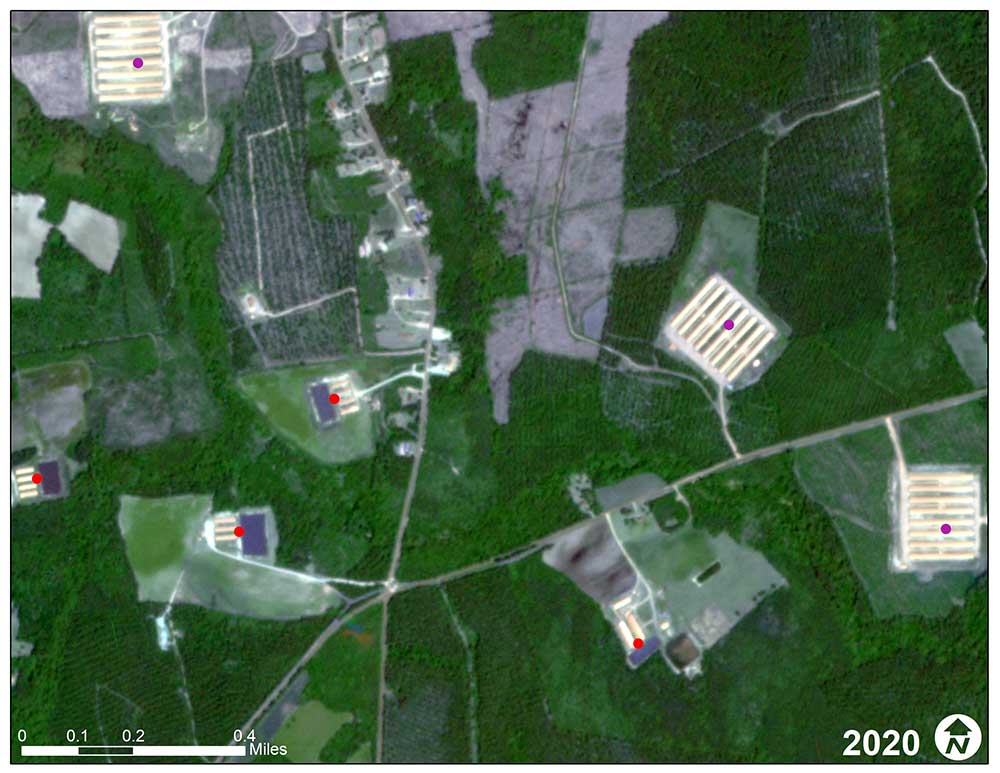
This dataset was created by surveying satellite imagery of North Carolina from 2019 (RapidEye 5m, Planet Scope 3m and North Carolina Orthophotography). Poultry operations were identified by distinctive clusters of long, metal barns with attached feed canisters. For each identified operation, we recorded a location and a count of barns.
Identified operations were checked for accuracy using 3-meter-resolution satellite imagery of North Carolina from 2019 (Planet Scope). Locations were not included if they appeared to be abandoned – for instance, locations where barns had no feed canisters, had dilapidated roofs or were overgrown.
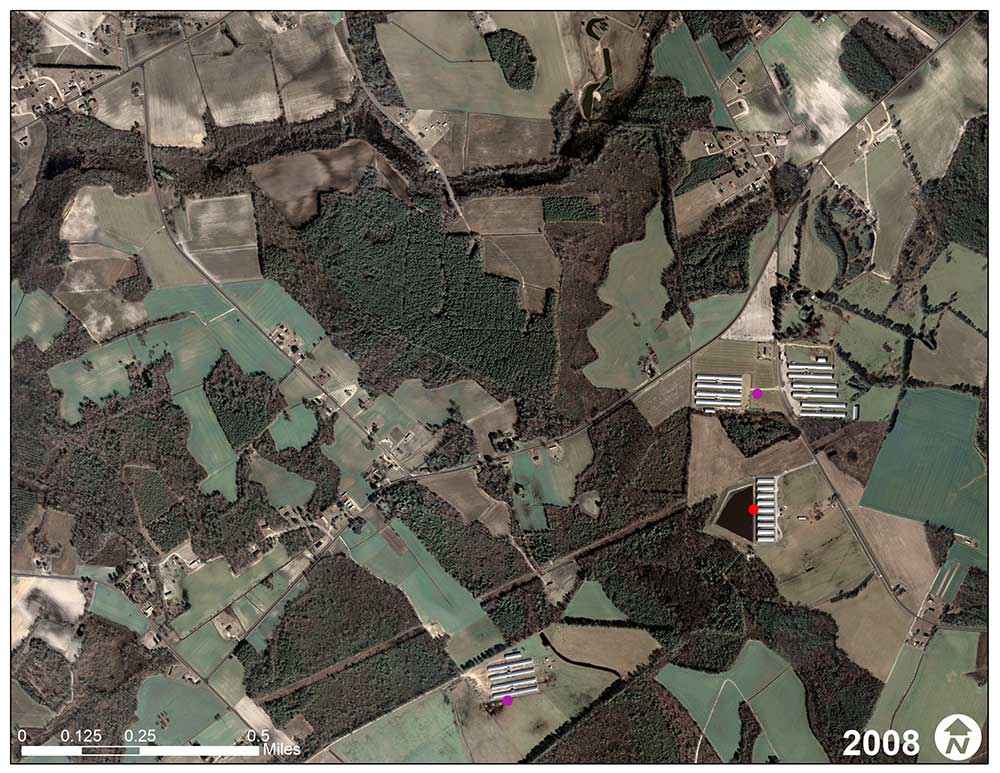
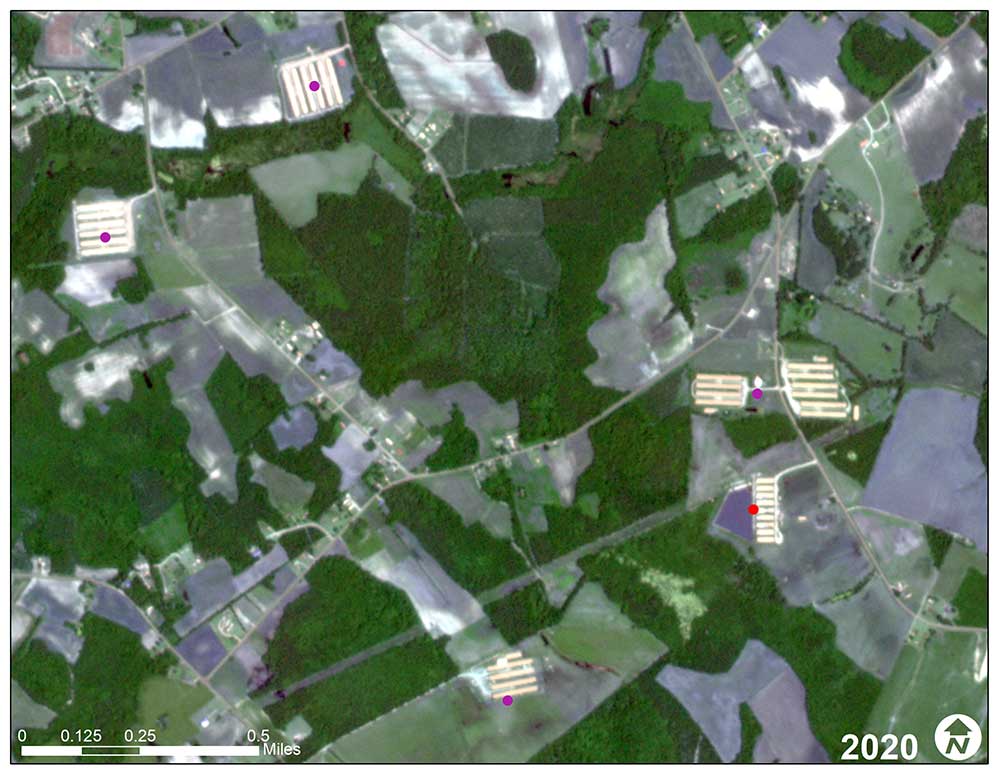
Operations were dated by comparing them to previous years’ imagery and recording the earliest year in which the operation is visible. Previous imagery was from the National Agriculture Imagery Program from 2008, 2012, 2016, 2018 and 2019, so the establishment of these operations can only be dated approximately to one of these years.
Swine and Cattle Locations
Data for swine and cattle operations were taken directly from the List of Permitted Animal Facilities (11-6-2019), compiled by the North Carolina Department of Environmental Quality.
To account for redundant facility locations, points were moved atop distinct barn locations to accurately portray spatial proximity to the 100-year floodplain and overlapping census blocks. The locations of facilities were also moved if they appeared within a noticeable distance from the actual facility location. If a facility location had multiple permits associated with only one point, a new location point was created and attributed if an adjacent facility existed.
Animal Counts
To estimate poultry animal counts, an average square footage per bird was used and then allotted to each barn, assuming a standard barn size for all poultry facilities in North Carolina. To identify a standard barn size, the 25 counties in the state with the most poultry facilities were identified, and one facility was selected at random within each of those counties.
Barn-building footprints were digitized for each selected facility, resulting in a total of 104 barns. The distribution of square footage for these 104 barns was normally distributed as shown below, with a mean barn size of 24,430 square feet. This value was assumed to be the size of every poultry barn in North Carolina.
The square footage allotted to each bird will vary depending on poultry production system – pullets, turkeys, broilers or layers. Square footage per production system was derived from industry standards and is listed in Table 1, along with the source. Broilers and pullets were combined, since a credible source for pullet square footage could not be found. In addition, pullets make up a very small proportion of total birds in North Carolina, according to the 2017 Census of Agriculture.
Table 1. Guidelines on square footage allotment by poultry production system
|
Recommended Square Footage Per Animal
|
|
|
Industry Guidelines
|
Source
|
|
Broiler and pullets
|
0.8
|
National Chicken Council
|
|
Layer
|
0.465
|
United Egg Producers
|
|
Turkeys
|
3.0
|
USDA NIFA
|
As the type of production system cannot be determined from aerial photography, and permit data do not exist for poultry facilities in North Carolina, the 2017 Ag Census was used to estimate the percentage of each poultry production system within each county. This by-county distribution was then applied to each facility within that county to allot bird populations, assuming a standard 24,430 square feet per barn.
Poultry Distribution
Although the distribution of production system varied by county, broilers were by far the most common across the state. The statewide distribution of production system was 81 percent broilers, 8 percent turkeys, 7 percent laying hens and 4 percent pullets (USDA Ag Census, 2017).
Manure Estimate
The 2018 North Carolina Agricultural Chemicals Manual, or NCACM, was used to calculate manure amounts for both poultry and swine. Methods used to derive total manure, nitrogen and phosphorus values for each animal system are described below.
Swine Manure Methods
The NCACM lists manure and nutrient values for the various swine production systems, including farrow-to-wean, farrow-to-feeder, farrow-to-finish, wean-to-feeder, wean-to-finish, and feeder-to-finish.
Permit data for swine include the production system for each swine facility, with feeder-to-finish making up more than half of all facilities in the state, followed by wean-to-feeder and farrow-to-wean (Table 2).
Table 2. Statewide distribution of swine production facilities in North Carolina from permit data
|
Swine Production System
|
Number of Facilities
|
|
Feeder-to-finish
|
1,151
|
|
Wean-to-feeder
|
450
|
|
Farrow-to-wean
|
297
|
|
Wean-to-finish
|
57
|
|
Farrow-to-feeder
|
25
|
|
Gilts
|
21
|
|
Farrow-to-finish
|
20
|
|
Boar/stud
|
11
|
|
Other
|
4
|
Allowable animal counts and production systems from permit data were used to assign manure and nutrient values to each facility, using values listed in Table 3. In cases where permit data included production systems not included in the NCACM (gilts, boar/stud and other), values for farrow-to-feeder were used.
Table 3. Swine manure production values for lagoon sludge and lagoon liquid, from NCACM
|
Manure Volume and Weights in Typical North Carolina Animal Production Systems
|
|
Animal Production System
|
Accumulated Manure (Gallons Per Animal Per Year)
|
|
Anaerobic lagoon liquid – swine
|
|
|
Farrow-to-wean (sow)
|
3,203
|
|
Farrow-to-feeder (sow)
|
3,861
|
|
Farrow-to-finish (sow)
|
10,478
|
|
Wean-to-feeder (pig)
|
191
|
|
Wean-to-finish (pig)
|
776
|
|
Feeder-to-finish (pig)
|
927
|
|
Anaerobic lagoon sludge – swine
|
|
|
Farrow-to-wean (sow)
|
78
|
|
Farrow-to-feeder (sow)
|
94
|
|
Farrow-to-finish (sow)
|
382
|
|
Wean-to-feeder (pig)
|
6.7
|
|
Wean-to-finish (pig)
|
26.3
|
|
Feeder-to-finish (pig)
|
33
|
Manure and nutrient values were found for both anaerobic lagoon liquid and anaerobic lagoon sludge, then summed to get total manure, nitrogen and P205 values in tons per year for each facility. P205 was multiplied by 0.44 to convert to elemental phosphorus, according to guidance provided by the Midwest Planning Service Livestock Waste Facilities Handbook (MWPS-18).
Poultry Manure Methods
In lieu of permit data for poultry facilities in North Carolina, the 2017 Ag Census was used to determine the distribution of poultry production systems within each county. This distribution was then assumed for all mapped poultry facilities in that county. This same by-county distribution from the 2017 Ag Census was used to determine animal counts for each facility, as has already been described. The four production systems for poultry included in the 2017 Ag Census and their respective production systems from the NCACM are shown in Tables 4 and 5.
Table 4. 2017 Ag Census production system and associated NCACM production system
|
Ag Census Production Systems
|
NCACM Production Systems
|
|
Broiler
|
Broiler – whole house
|
|
Pullets
|
Broiler pullets
|
|
Layers
|
Layers
|
|
Turkeys
|
Turkey – hen
|
Table 5. Poultry manure production values, from NCACM
|
Manure Volume and Weights in Typical North Carolina Animal Production Systems
|
|
Animal Production System
|
Tons Per 1,000 Bird Capacity Per Year
|
|
Poultry litter – broilers
|
7.2
|
|
Poultry litter – broiler pullets
|
7.2
|
|
Poultry litter – layers
|
24
|
|
Poultry litter – turkeys
|
25
|
Demographics
Data on race, ethnicity and household were derived from the 2010 census summary file 1 at the block level and compiled by the U.S. Census Bureau. Populations categorized as “Other” are represented by the terms American Indian and Alaska Native, Asian, Native Hawaiian and Other Pacific Islander, Some Other Race and Two or More Races.
References
NCACM, 2020 North Carolina Agricultural Chemicals Manual, College of Agriculture and Life Sciences, North Carolina State University, Dec. 18, 2019.
MWPS-18, Livestock Waste Facilities Handbook. 1993. Midwest Plan Service (MWPS): Ames, Iowa.
US Department of Agriculture, National Agriculture Imagery Program. Aerial Photography 2008, 2012, 2016 and 2018. Available at https://www.fsa.usda.gov/programs-and-services/aerial-photography/imagery-programs/naip-imagery/. Accessed January 1, 2019. USDA – Aerial Photography Field Office, Salt Lake City, Utah.
Planet Team (2019). Planet Application Program Interface: In Space for Life on Earth. San Francisco, CA. https://api.planet.com.


