In California’s San Joaquin Valley, the nation’s leading agricultural region, Latinos make up the great majority of farmworkers.
They are also disproportionately likely to live in communities where drinking water supplies are contaminated with elevated levels of nitrate, a toxic chemical that primarily comes from polluted farm runoff.
Nitrate contamination of drinking water is widespread in California: Tests by utilities have detected some level of nitrate in the finished water supplies for more than two-thirds of all Californians. But it’s worst in the eight counties of the San Joaquin Valley,1 and worse still in majority-Latino communities in those counties.
EWG analyzed California State Water Resources Control Board data on the Valley communities with nitrate levels in drinking water meeting or exceeding the federal legal limit. We found that almost six in 10 are majority-Latino. Latinos are also a majority in Valley communities with nitrate at or above half the legal limit, which is linked to increased risk of cancer and other diseases.
Under the federal Safe Drinking Water Act, the legal limit for nitrate (measured as nitrogen) in community water systems is 10 milligrams per liter, or mg/L. This limit was set based on a 1962 U.S. Public Health Service recommendation to guard against so-called blue baby syndrome, a potentially fatal condition that starves infants of oxygen if they ingest too much nitrate. But more recent studies show strong evidence of an increased risk of colorectal cancer, thyroid disease and neural tube birth defects at levels of 5 mg/L or even lower.
The chart below shows the 20 Valley community water systems with the highest average levels of nitrate contamination between 2003 and 2017, and the percentage of residents who identified as Latino in the 2018 American Community Survey, for the census block group where each water system was located.2
San Joaquin Valley Community Water Systems With the Worst Nitrate Contamination
| System Name | 2003-2017 Nitrate Average in mg/L | Percent Latinos in Census Block Group |
|---|---|---|
| Rodriguez Labor Camp | 27.3 | 81.8% |
| Tony Morris/Morris Dairy | 23.5 | 58.8% |
| Sierra Mutual Water Company | 21.5 | 36.0% |
| Soults Mutual Water Company | 16.7 | 73.3% |
| Beverly Grand Mutual Water | 16.7 | 78.2% |
| East Wilson Road Water Company | 13.1 | 79.4% |
| Lemon Cove Water Company | 12.8 | 18.6% |
| Sierra Vista Association | 12.7 | 60.1% |
| Wilson Road Water Community | 12.6 | 73.6% |
| San Joaquin Estates Mutual Water Company | 12.2 | 41.5% |
| Del Oro River Island Service Territory #2 | 11.7 | 50.3% |
| Faith Home Teen Ranch | 10.5 | 25.0% |
| El Monte Village Mobile Home Park | 10.4 | 20.7% |
| Plainview Mutual Water Company, Central Water | 10.2 | 81.8% |
| Son Shines Properties | 9.9 | 32.1% |
| Hillview Water Company, Raymond | 9.6 | 16.3% |
| Lake Success Mobile Lodge | 9.6 | 50.3% |
| Triple R Mutual Water Company | 9.5 | 13.2% |
| R.S. Mutual Water Company | 9.4 | 2.7% |
| East Orosi Community Services District | 9.3 | 80.3% |
Source: EWG, from Calif. State Water Resources Control Board and 2018 American Community Survey.
Between 2003 and 2017, tests detected elevated levels of nitrate in the finished water of hundreds of the state’s towns and cities located in census block groups where the population was 50 percent Latino or higher:
- 415 majority-Latino community water systems serving more than 9 million people tested at or above 3 mg/L.3
- 318 systems serving 8.1 million people tested at or above 5 mg/L.
- 140 systems serving 5.25 million people tested at or above 10 mg/L.
This interactive map shows all San Joaquin Valley community water systems with a majority-Latino population that had elevated levels of nitrate in the period analyzed. Clicking on a point brings up information for the census block group where the community water system is located. The percentage of Latino population and 2018 mean household income are given for each census block group.
Source: EWG, from Calif. State Water Resources Control Board and 2018 American Community Survey.
As nitrate levels rise, the likelihood that a community is majority-Latino also goes up. Thirty-five percent of all California communities with nitrate levels of 3 mg/L or more were majority-Latino, but that went up to 38 percent for communities that tested at or above 5 mg/L, and 42 percent that tested at or above 10 mg/L.
Contamination in the San Joaquin Valley
For decades, small communities in the San Joaquin Valley that are home to many Latino farmworkers have had dangerous levels of nitrate in their water. These laborers work by day in the same fields that pollute the water they use at night at home. In many of these communities, levels of nitrate and other contaminants are so high that residents must buy bottled water for cooking and drinking.
The San Joaquin Valley has been hit disproportionately hard by COVID-19. As of the last week of August, there had been more than 110,000 confirmed cases in the eight Valley counties alone – almost one in six of all cases in the state. Latinos are also disproportionately affected by the pandemic: They are about 40 percent of California’s population but make up about 60 percent of COVID-19 cases. In the pandemic-triggered economic crisis, it’s even harder to have to pay for both contaminated tap water and clean bottled drinking water.
In the San Joaquin Valley, between 2003 and 2017:
- 199 majority-Latino systems, serving almost 2.3 million people, tested at or above 3 mg/L. Ninety-one percent of these systems rely on groundwater as their source of drinking water.
- 157 systems serving 2.2 million people tested at or above 5 mg/L.
- 69 systems serving close to 1.5 million people tested at or above 10 mg/L.
In the Valley, 50 percent of communities with nitrate levels of 3 mg/L or more were majority-Latino. That goes up to 53 percent of communities that tested at or above 5 mg/L, and 56 percent that tested at or above 10 mg/L.
Most of the majority-Latino communities struggling with nitrate were also low-income. Of the communities with elevated nitrate, 98 percent, serving almost 2.3 million people, were in a census block group with a 2018 average household income below the state’s average income. The average income across all majority-Latino communities in the Valley with elevated nitrate was $49,367, less than half of the state’s average of $101,493.
Of all majority-Latino communities in the Valley with elevated nitrate, 65 percent – 130 communities serving almost 956,000 people – had contamination that got worse between 2003 and 2017.
Although nitrate pollution can also come from wastewater treatment plants and septic systems, agriculture is the main source of nitrate in California’s drinking water. In the San Joaquin Valley, more than 90 percent of nitrate in the groundwater comes from agriculture, which is by far the biggest business in the Valley, whose farmers produce more than half of the state’s agricultural products.
When nitrogen fertilizer and animal manure are applied to farm fields, rain washes nitrogen off fields and into sources of drinking water. Irrigation is a main culprit for nitrate contamination of groundwater: The water from extensive irrigation of cropland forces nitrogen from fertilizer and manure into and through soil to pollute groundwater.
Case Studies in the San Joaquin Valley
East Orosi
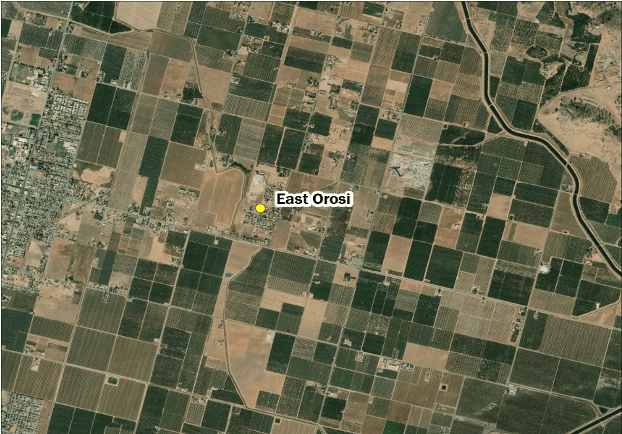
East Orosi, an unincorporated community in Tulare County, uses groundwater as its drinking water source, and the water system serves around 700 people. The community has struggled with high nitrate levels for many years.
EWG’s analysis shows that East Orosi had annual nitrate averages above 10 mg/L, the legal limit, in nine of the 15 years between 2003 and 2017, and that every year’s average was above 5 mg/L. Over that period, the community’s nitrate levels grew by 53 percent.
Most residents of East Orosi are low-income farmworkers and their families. As of the 2010 census, 94.1 percent of residents were Latino. And as of 2018, East Orosi was located in a census block group with an average income of $62,703, compared with the state average of $101,493.
Because nitrate levels are so high, water costs hit residents’ wallets twice – for the unsafe water from their taps and for bottled water that is safe to drink.

East Orosi is surrounded by farmland.
Source: Esri basemap
Woodville
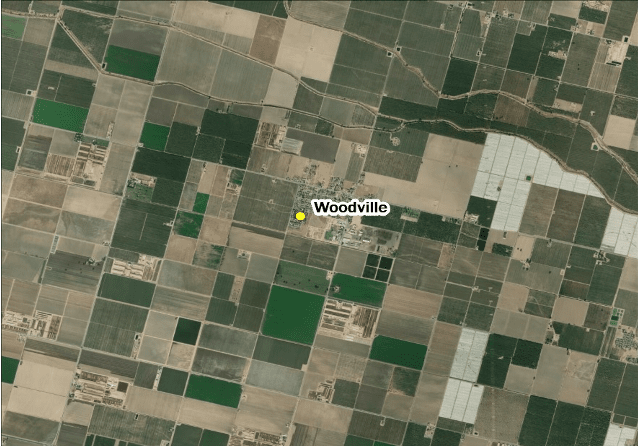
Woodville, also in Tulare County, gets its drinking water from groundwater, and the water system serves around 1,673 people. In each of the 15 years between 2003 and 2017, Woodville had annual nitrate averages above 5 mg/L, and in 2017 the average was 9.4 mg/L, just under the legal limit. Over that period, the town’s nitrate levels grew by almost a third.
Most of the people who live in Woodville are also low-income farmworkers. As of the 2010 census, 88.8 percent of residents were Latino. And as of 2018, Woodville was located in a census block group with an average income of $38,254.
Woodville has high nitrate levels in the water because the town is encircled by dairies. Manure from the dairies wreaks havoc on the water in the two wells the town uses. Because groundwater levels have dropped, to tap into cleaner water supplies, the system has been forced to continuously drill wells deeper and deeper. At one point, one of the wells collapsed because water levels were too low, and that damage cost $70,000 to fix.

Large dairies and agricultural fields can be seen just outside of Woodville.
Source: Esri basemap
Ceres
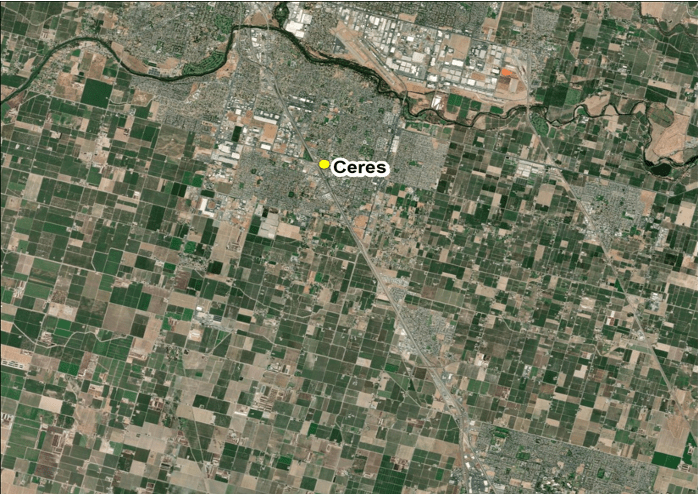
Ceres, in Stanislaus County, also gets its drinking water from groundwater, and the water system serves 47,754 people. Ceres had annual nitrate averages above 5 mg/L in each of the 15 years between 2003 and 2017, except for 2004, when the average was 4.5 mg/L. During that period, the town’s nitrate levels grew by 31 percent.
As of the 2010 census, 56 percent of people in Ceres were Latino. In the 2018 census block group that includes Ceres, 75.6 percent of residents are Latino. Average income in that block group is much lower than the state average: $57,953, compared with $101,493.
Residents of the town have long had to use bottled water for cooking and drinking. Although nitrate levels have been high for many years, it’s not the only drinking water contaminant in Ceres’ water. Arsenic and a pesticide chemical called 1,2,3 TCP, linked to cancer, have also been found in the city’s water. And the water is expensive: Last year, Gov. Gavin Newsom noted that people in Ceres pay more for their water than those in Beverly Hills.

Ceres is flanked by farm fields to its east, south and west.
Source: Esri basemap
Solutions
Widespread nitrate contamination of drinking water in California is a complex problem. Solving it will require tougher farm regulations and a lot of money to clean up polluted water systems. In 2019, the state established the Safe and Affordable Drinking Water Fund, which was intended to provide $130 million a year for the next decade to communities to help rebuild or improve drinking water infrastructure.
But the pandemic-triggered economic crisis has put the money on hold. Because of how it is funded, it’s uncertain how much money will go into it.
State and local agencies also have plans to address pollution from farms. But these plans rely on monitoring fertilizer and manure use, and it will be decades before any regulation of agricultural activities gets put in place. Real regulations on farm pollution and dedicated funding for water systems that won’t disappear in an economic downturn are needed to fix this statewide problem.
Notes
1 Fresno, Kern, Kings, Madera, Merced, San Joaquin, Stanislaus and Tulare.
2 People who identify as Hispanic or Latino can be of any race.
3 The U.S. Environmental Protection Agency says: “While nitrate does occur naturally in groundwater, concentrations greater than 3 mg/L generally indicate contamination (Madison and Brunett, 1985), and a more recent nationwide study found that concentrations over 1 mg/L nitrate indicate human activity” (Dubrovsky et al. 2010).


